


A mobile app that implements empathy into weather
Reimagining weather alerts utilizing open APIs like weather data and newsfeeds to provide user communication to allow aid during environmental disasters.
OVERVIEW


The Open Data for Good Grand Challenge seeks to reward the most creative and high-impact uses of open data in digital tools that solve problems for the public. Teams must submit their product in at least 1 of 3 categories. Our team selected Climate, Resilience, and the Natural Environment. We targeted community resilience to climate change and other climate challenges.
Challenge
We’ve all experienced bad weather but what happens when bad weather takes a turn for the worst? How prepared are you? What do you do when emergency services are unreachable? Who do you turn to? While other states rushed to social media sharing memes of Texas during the winter storm in February 2021, more than 4.5 million homes and businesses were left with no power which led to shortages of food, water, and heat, some for several days. At least 210 people were killed directly or indirectly, with some estimates as high as 702 deaths as a result of the Texas power crisis. This crisis drew much attention to the state's lack of preparedness for such storms. The worst can happen when the weather gets in your way. Weather may be unpredictable, but planning doesn’t have to be. If we can plan ahead for our local weather emergencies, our community will have support, peace of mind, and a way to ask for help. How can we create a platform to empower users within communities to provide or request aid from one another and strengthen community resilience?
the Project mission
Find a unique way to empower users to improve preparedness, stay ahead of easy-to-understand weather alerts, and create camaraderie in local areas during climate crises.
Project Scope
Build a live web platform for good that uses open data regarding climate.
Tools
Miro, Zoom, Slack, Figma
Role
Co-Lead UX Designer
Groups
5 UX Designers
2 Data Scientists
2 Software Engineers
1 Project Manager
Duration
5 Weeks
+ 5 Weeks revised
Deliverable
Hi Fidelity Figma
Live Web Prototype
Our Design process

Understanding the problem
Before we could tackle a single problem, we needed to identify the best problem that had the most impact on communities, climate, and the environment.
My research encompassed:
-
Understanding the user needs and goals.
-
Uncovering pain points with the existing user journey during disasters.
-
Validating the correlation between climate and emergencies.
-
Confirming that users' saved weather locations have personal meaning.
Research Methods
User Interviews
Screener Surveys
C&C Analysis
Secondary Research
Discover
Gathering Insights
Our team conducted a brainstorming session to ideate on potential ideas to begin. With a fully remote team, we all pitched in our own personal experiences with climate and the environment. Some teammates from New York fixated on the events of Hurricane Irma which caused major flooding. I presented on more recent events like the Texas freeze of 2021.
I allowed further exploration of my teammates to dive deeper into the discovery phase. We sent out surveys to gauge user interest in flooding predictions and real estate over the span of 30 years.
Unfortunately, our Lead UX designer made an executive decision to narrow our focus on New York flooding and the real estate market despite receiving results from our surveys showing a lack of interest in either.


Asking the wrong questions
To get to the right ones
I held an emergency team meeting with our project manager, data scientists, software engineers, UX designers, and stakeholders to address the bigger problems:
-
Who are we designing this for (real estate agents)?
-
Do people need this?
-
What will bring users back to reuse this?
-
Are we working within SE and DS constraints?

Users showed more concern for sea level rising in general.

Users did not worry enough about flooding to purchase flood insurance in NYC.

Sea Level Rise Viewer already exists and many sources state its inaccuracy.
Key Quotes From User interviews
Have you looked into the effect of sea level rise on NYC? Why or why not?
“Yes, I couldn't find much detailed information on what the effects will be.”
“Yes because we are concerned. We're considering settling in San Francisco or Seattle.”
“No, don't care.”
“No, probably won't ever be able to afford waterfront property.”
Issues with focusing on Sea Level rising & Real estate Market
-
Users said they care but not enough to get flood insurance.
-
The user solution is to avoid locations with rising sea levels so they would move elsewhere.
-
Coastal home buyers are made aware of the sea levels rising during the closing process.
Competitive & Comparative Analysis
-
This has been done for tracking past data. It isn't possible to accurately predict 30 years into the future of rising sea levels.
-
The application only shows data and provides no reason to reuse the application.
Technical Constraints
-
Predictive data for the sea level rising is inaccurate and discredits the service and product if we create it.
-
Building a map that shows the sea level rise over 30 years is outside of the capabilities of our DS and SE teams.
Define
Focusing on Weather data and newsfeed updates


The bigger problem
Users need a simple way to stay connected within their community regarding weather so that they can assist others in need and be prepared for catastrophic events.
The Solution:
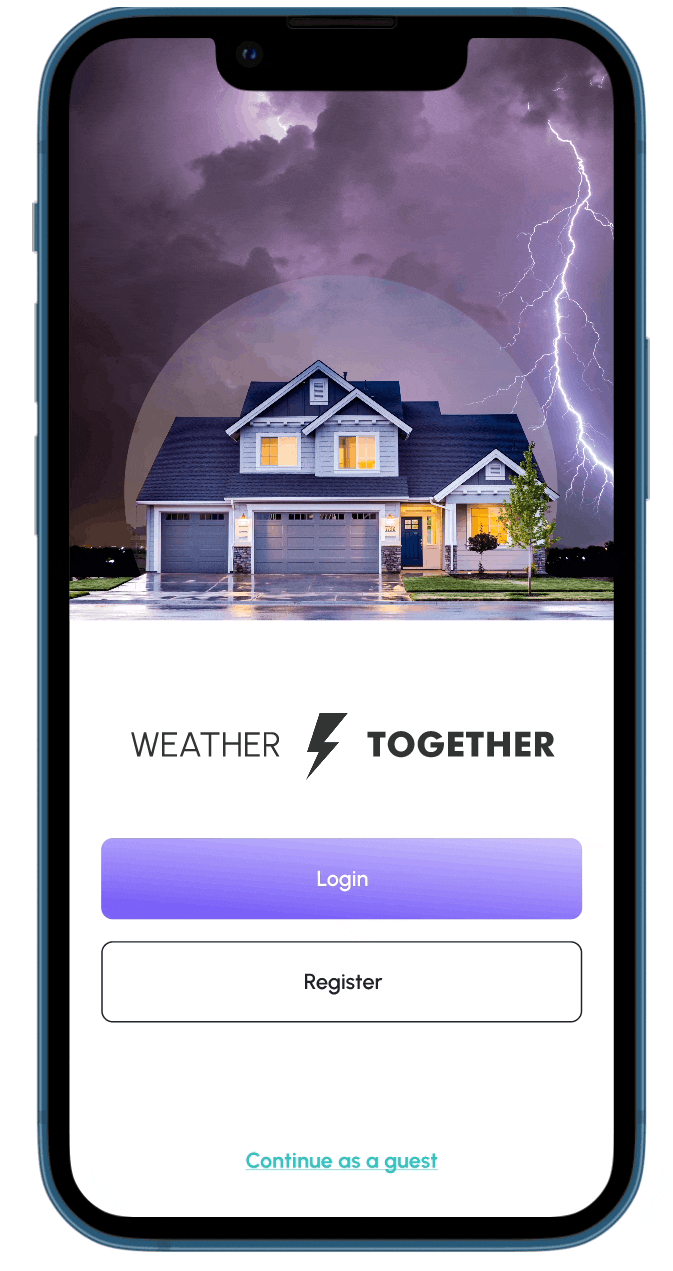
Weather Together
Provide users with a mobile application that allows them to request help or provide that help to neighbors within the same zip code. A simple form is all that is needed to request or respond to neighbors in need during disastrous weather.
When emergency dispatchers are overwhelmed with vast numbers of residents in need, Weather Together can provide that lifeline of communication to bring unity within the community to weather the storm together.
Key features
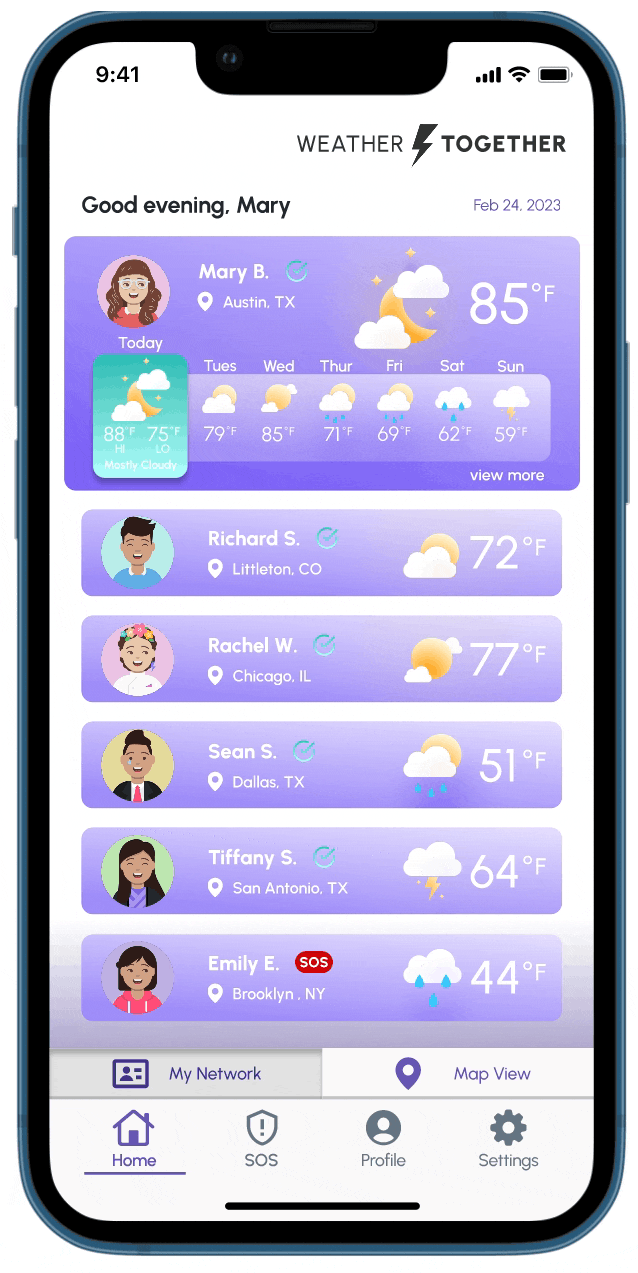
Giving the user the power to follow close friends and loved ones.
Upon logging into the mobile application, the user is able to quickly view her list of friends and family. Each profile card is clickable to view more weather information, location, and SOS status.
Important information like posting one's safety and well-being is the main focus of this dashboard.
Allowing users to view the status of loved ones and weather from a global perspective.
The user has the option to change from a card view of her friends and loved ones to a global bird's eye view via the map view. The color of the GPS pins indicates whether one is safe or in a state of emergency.
By tapping on the user's red GPS pin, one can see the ZIP code area, view the emergency types, the essentials requested for aid, and if anyone has responded to her request.

Create an SOS request for help within your ZIP code easily.
In the event of an emergency, a resident in need can fill out a simple form that provides the type of emergency one is dealing with and what essentials one needs to broadcast a beacon for others in the ZIP code to be notified.
Quickly respond to nearby neighbors in need with real-time notifications.
Users that live in the same ZIP code will be notified when a neighbor submits an SOS request. This allows users to act quickly to discuss a plan of action whether it's first aid, EVAC assistance, or delivering supplies.
Similar to Bumble, the user who posted the SOS request must choose to accept the response to begin the messaging conversation and planning.

Note: The above designs are from my revisions of the original team design.
Design
Let's begin with how I came up with my solution.
After getting to know our users' pain points and defining the problem statement. I began to ideate about the user flow.
It must be simple to navigate quickly from card view to map view.

User needs to check weather and safety status of loved ones.
User needs a way to request for help quickly so others nearby can be notified.


User needs a way to respond quickly to an SOS report from a neighbor nearby.


Revised sketches of the wireframes with pen and paper
Utilizing these sketched wireframes, I imported the images into Marvel to create a simple prototype to test on a handful of users.
The feedback received led to a handful of changes like Navigation placement moving to the bottom of the screen.
Next Steps
Piecing it all together, I created lo-fidelity wireframes in Balsamiq implementing my user feedback. Beginning with a basic login screen, these show the user flow of a solo run.